Colored Data
Customize the visual representation of any indicator — apply different colors based on value behavior relative to zero for instant trend recognition.
Download Free
How it works
The Colored Data indicator allows you to customize the visual representation of any other indicator. First, select your source indicator — such as a MACD histogram or an RSI line — and then choose how you want it displayed. The tool applies different colors based on value behavior relative to zero, making trends and reversals easier to spot at a glance.
What can I use it for?
Multi-Colored MACD Histogram
Transform the standard MACD histogram into a vibrant, multi-colored display. Set specific colors for values below zero decreasing, below zero increasing, above zero increasing, and above zero decreasing — making momentum shifts immediately visible.
Enhanced RSI Visualization
Convert the RSI line into a dynamic, color-coded graph. Assign distinct colors for increasing and decreasing movements to instantly recognize when momentum is picking up or slowing down.
Adaptive Trend Analysis
Use on any trend indicator to create a color-coded representation that highlights directional changes. Whether tracking a moving average or another tool, customized colors make trend shifts immediately noticeable.
Custom Volume Display
Apply Colored Data to a volume indicator to differentiate rising and falling volume levels with color cues — offering a clearer picture of market participation during key trading periods.
Settings
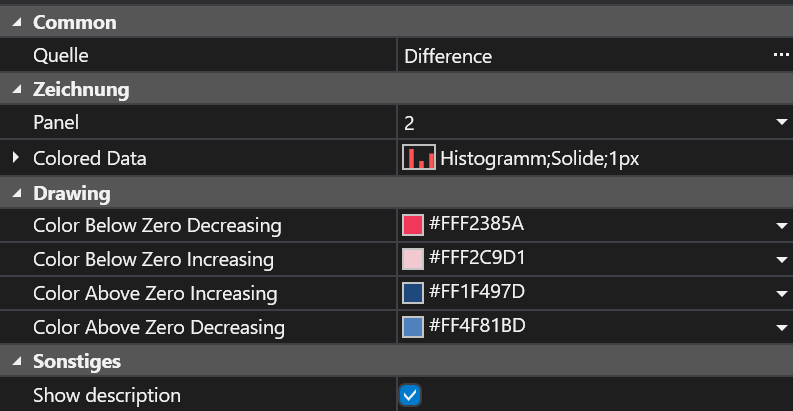
Panel
The chart panel where the customized display will appear. Choose the panel that houses your source indicator.
Display Type
Determines how the source indicator is rendered — Histogram, Line, or other styles.
Color Below Zero Decreasing
Color applied when the source indicator is below zero and falling — highlights bearish momentum.
Color Below Zero Increasing
Color used when below zero but trending upward — signals a potential reversal.
Color Above Zero Increasing
Color for above-zero increasing values — reflects bullish momentum.
Color Above Zero Decreasing
Color for above-zero but falling values — suggests caution, bullish strength may be waning.
Frequently Asked Questions
Can I apply Colored Data to any indicator?
Yes, simply choose your source indicator from the available options and customize the visual settings to match your analysis style.
How do the color settings enhance my trading decisions?
The customized color cues instantly highlight shifts in momentum and trend direction, allowing for quicker recognition of potential trade signals.
Get Colored Data
Subscribe to download all indicators for free — including future updates.